
01
Environmental reporting
Bring together process and lab data to simplify recurring environmental reporting.

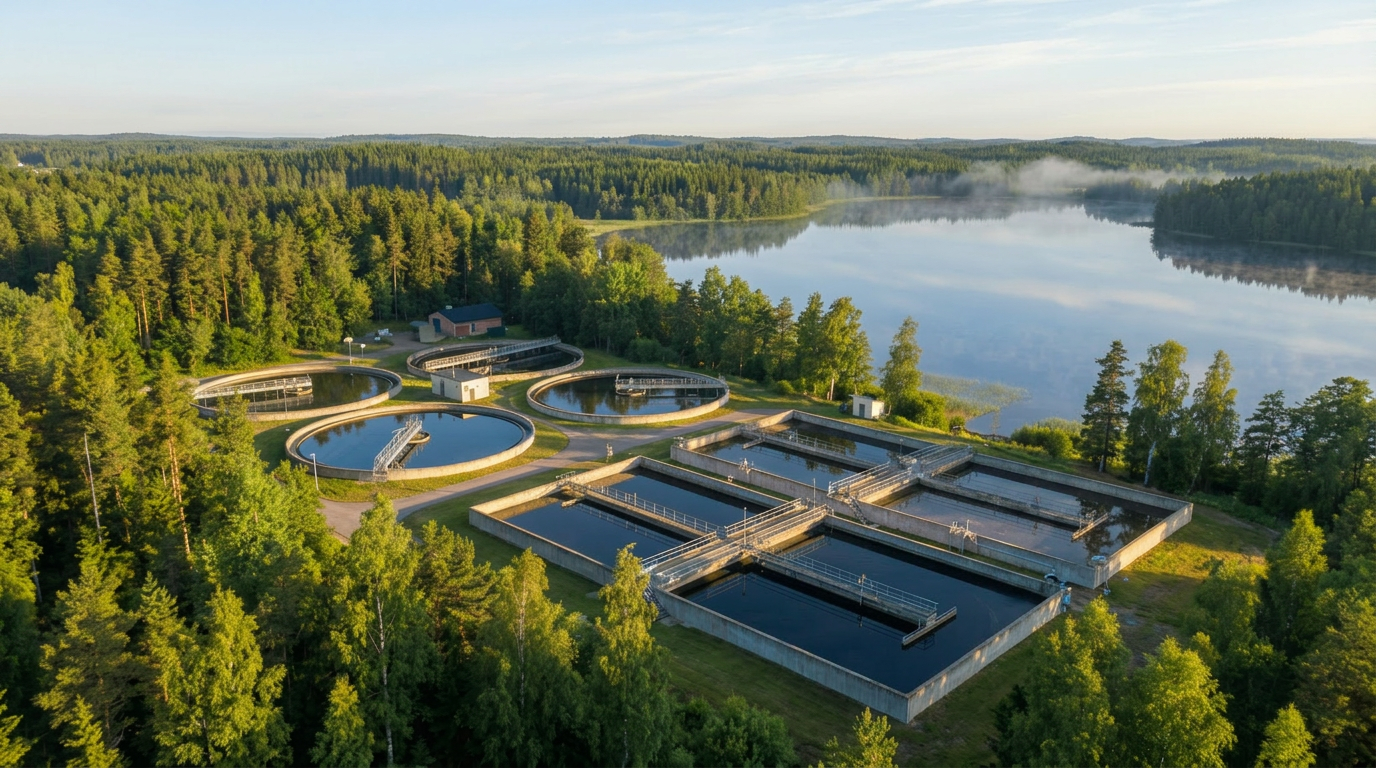
Water
aCurve helps water teams turn sensor data from multiple sources into a clearer operational view. Make data easier to use across teams, improve reporting and detect deviations earlier in daily operations.

The challenge
Water operations rarely run on one clean, unified flow of data. Signals come from different systems, sites and processes, often mixed with delayed lab results, reporting requirements and manual handling. To stay in control, teams need more than access to data. They need a reliable way to connect it, structure it and turn it into something they can actually act on.
Explore the plant
Hover or tap the points on the plant to explore where aCurve connects, structures and turns sensor data into a clearer operational view.
Link key measurement points across the plant and turn them into a shared operational overview. aCurve connects signals, creates clearer structure and context, and helps teams interpret trends so deviations surface early and reporting becomes easier.
The platform can be introduced step by step, starting with one area and expanding as routines mature.
Typical use cases in Water
aCurve supports a wide range of day-to-day workflows in water operations. From recurring reporting to early deviation detection, the platform helps teams turn fragmented data into clearer routines and better operational decisions.
01
Bring together process and lab data to simplify recurring environmental reporting.
02
Track events, document deviations and keep overflow reporting more consistent.
03
Connect process data to operational outcomes and process performance to understand where variation starts.
04
Detect unusual patterns, operational changes and emerging deviations earlier, making them easier to investigate and act on.
05
Compare periods, follow trends and understand what drives stability and resource use.
06
Spot patterns that may indicate wear, drift or emerging operational issues.

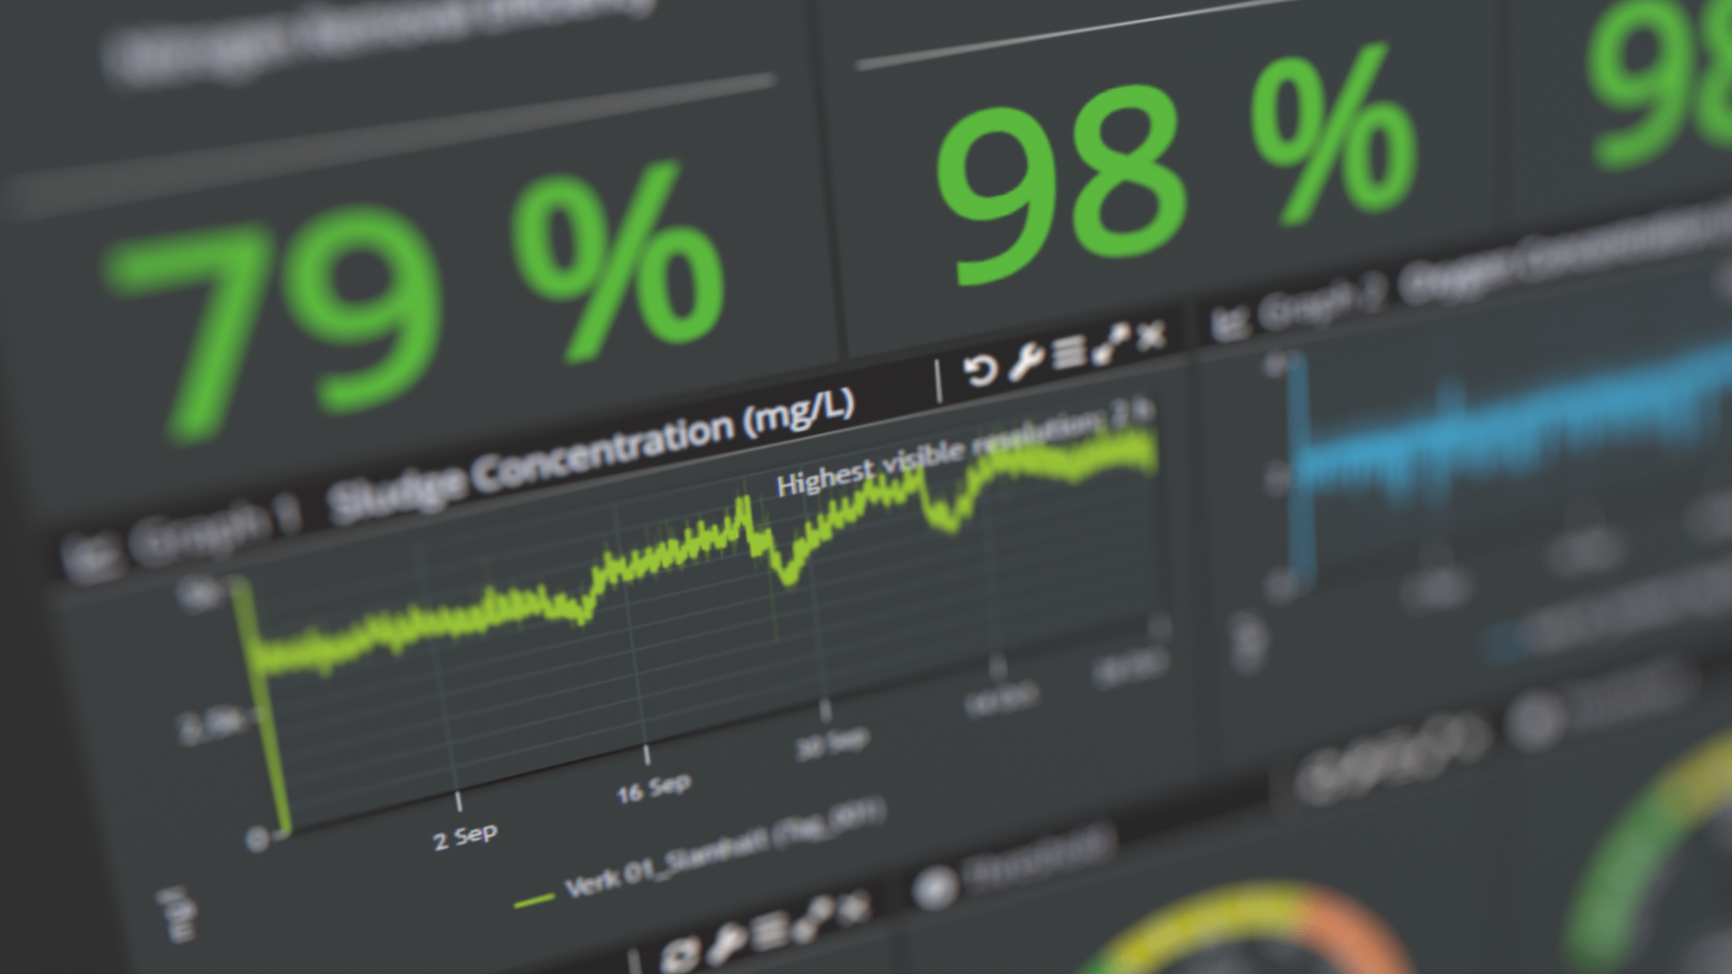
See what's happening. Understand why. Improve what matters.
Bring together data from SCADA, historians, lab systems and IoT sources.
Explore trends, correlations and anomalies with powerful self-service analytics.
Turn insights into better decisions, higher efficiency and improved process performance.
Part of Water
Alongside aCurve, EnvoMap supports upstream environmental work within the broader Water offering. It helps teams organise information about sources, sites and follow-up in a map-based interface, creating a clearer overview of the surrounding context beyond the plant itself.

Operational outcomes in water
aCurve brings together process data, lab results and reporting flows into one structured operational view. Teams get clearer visibility into plant performance, making daily decisions more confident and follow-up more efficient.

Operational outcomes in water
By bringing signals together and comparing patterns across the plant, aCurve helps teams spot changes earlier. This creates a better basis for follow-up, faster response and more confident operational decisions.

Operational outcomes in water
aCurve makes it easier to understand how different parts of the plant are performing over time. With a more reliable operational overview, teams can compare trends, understand drivers and work more systematically with improvement.
What teams say about aCurve
aCurve gives us a powerful tool with unlimited possibilities to both process and create reports of data.
Michael Medóc
Process Engineer
Käppala Association, Stockholm Sweden.
Trust in water operations is built over time. It depends on secure access to data, clear governance, reliable processes and support that helps teams maintain control in day-to-day work. aCurve is designed to provide a stable foundation for long-term use in environments where reliability, compliance and operational continuity matter.
Designed for water operations where secure access to data and clear separation from critical OT environments matter.
Supports stronger governance, traceability and reporting in environments with growing regulatory and operational demands.
Built for lasting use with dependable operation, flexible deployment and the support needed to establish stable routines over time.
Explore more industries
Explore how aCurve helps teams connect, structure and act on operational data across different environments.