
01
Integrations and adapters
Store and structure operational data in a stable environment built for long-term use.
Connect · Democratize · Act
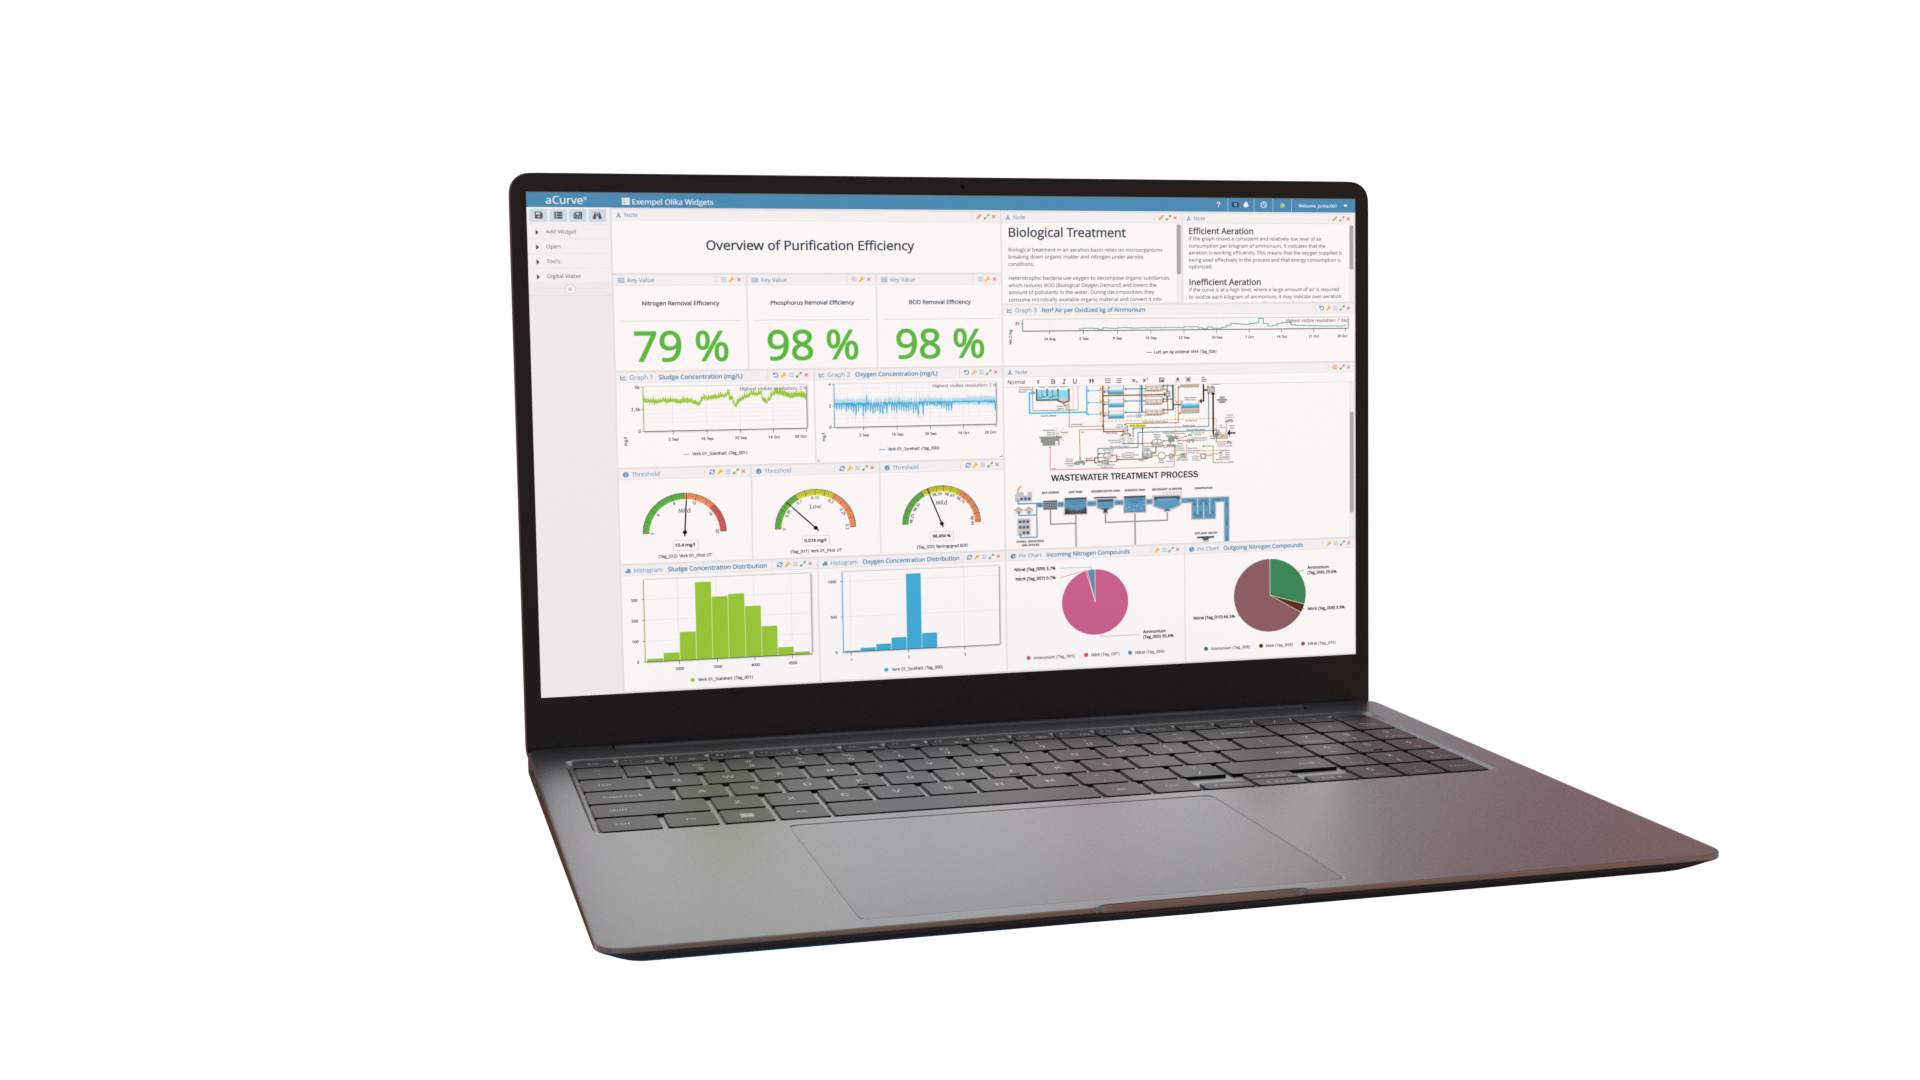
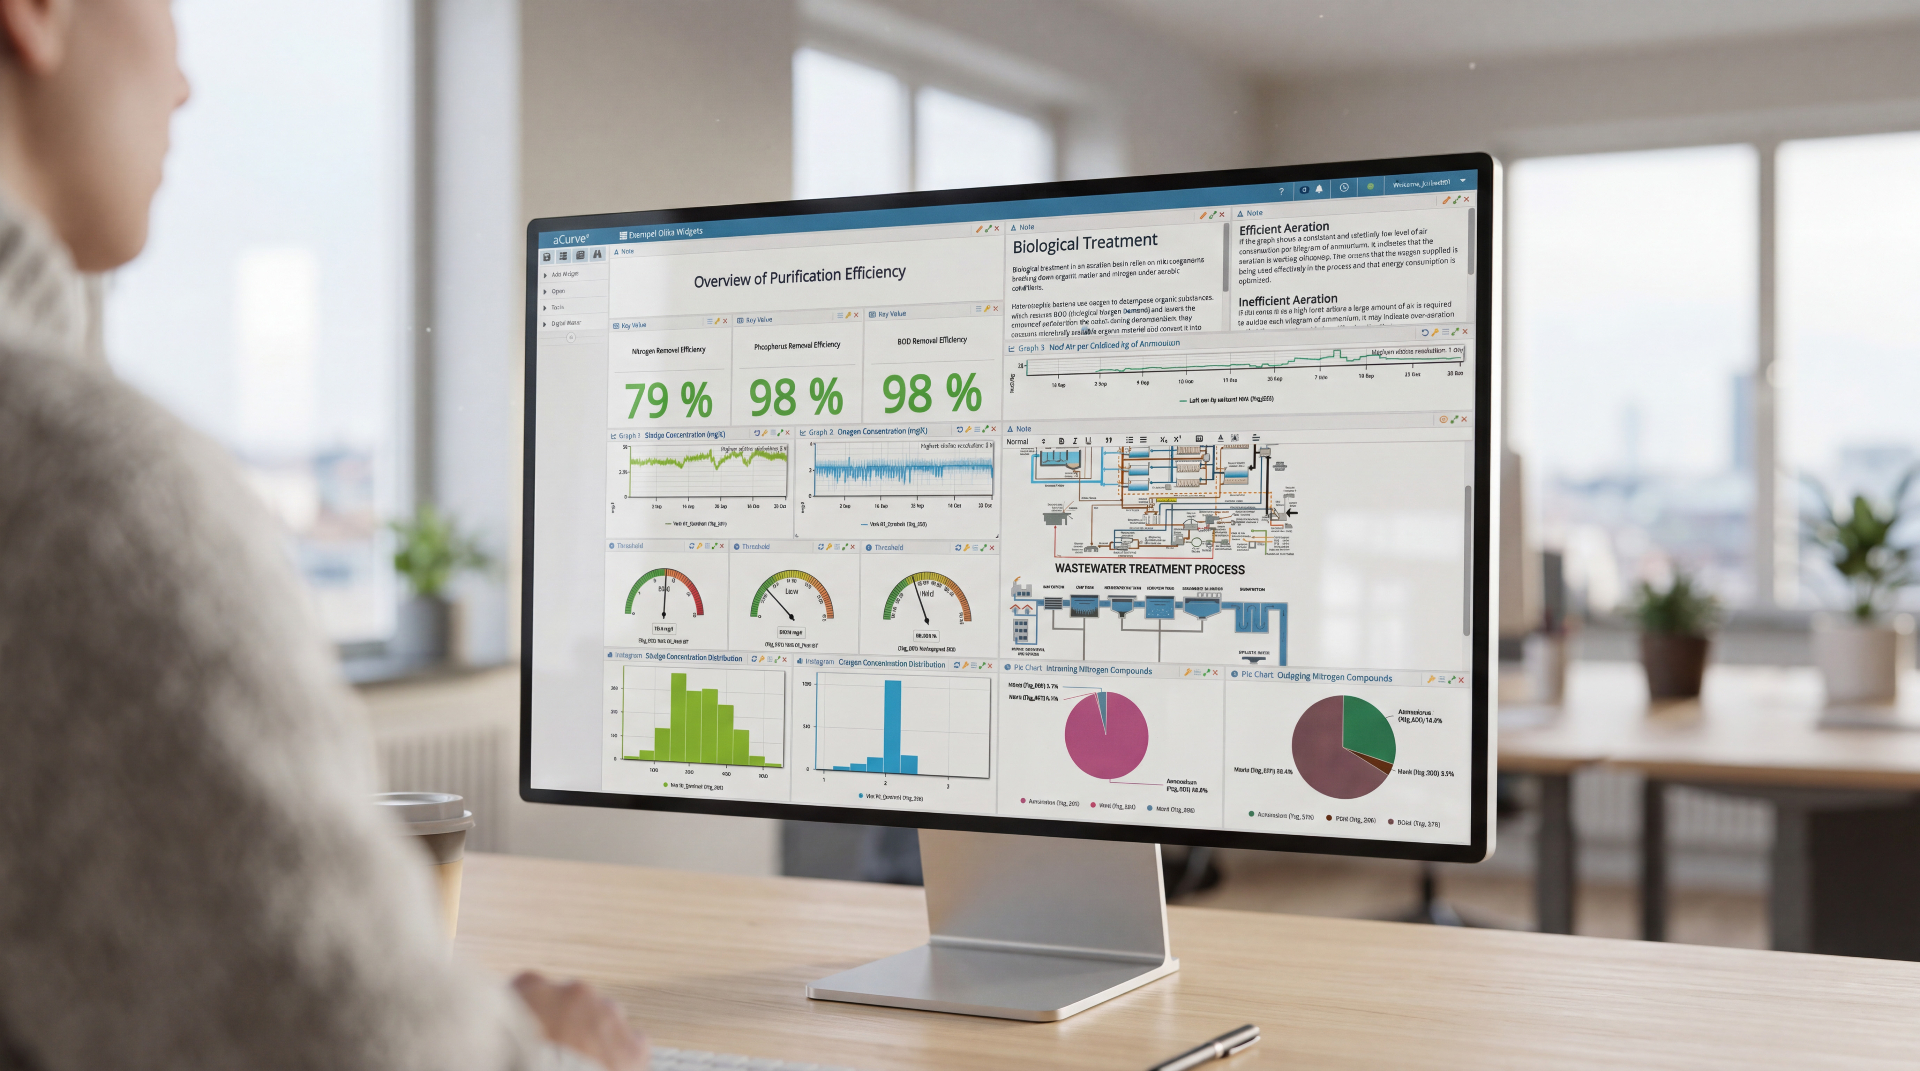
aCurve is a web-based platform that brings sensor data from multiple sources into one shared operational view. By making operational data available and understandable across teams, it helps organisations interpret trends, follow up operations and build reports they can rely on day to day.

At a glance
aCurve turns fragmented operational data into a structured and usable foundation for analysis, reporting and decision-making. Rather than adding another isolated tool, it creates a stable layer between raw sensor inputs and the people who need to act on them, resulting in a clearer workflow for monitoring, reporting and daily operations.

The challenge
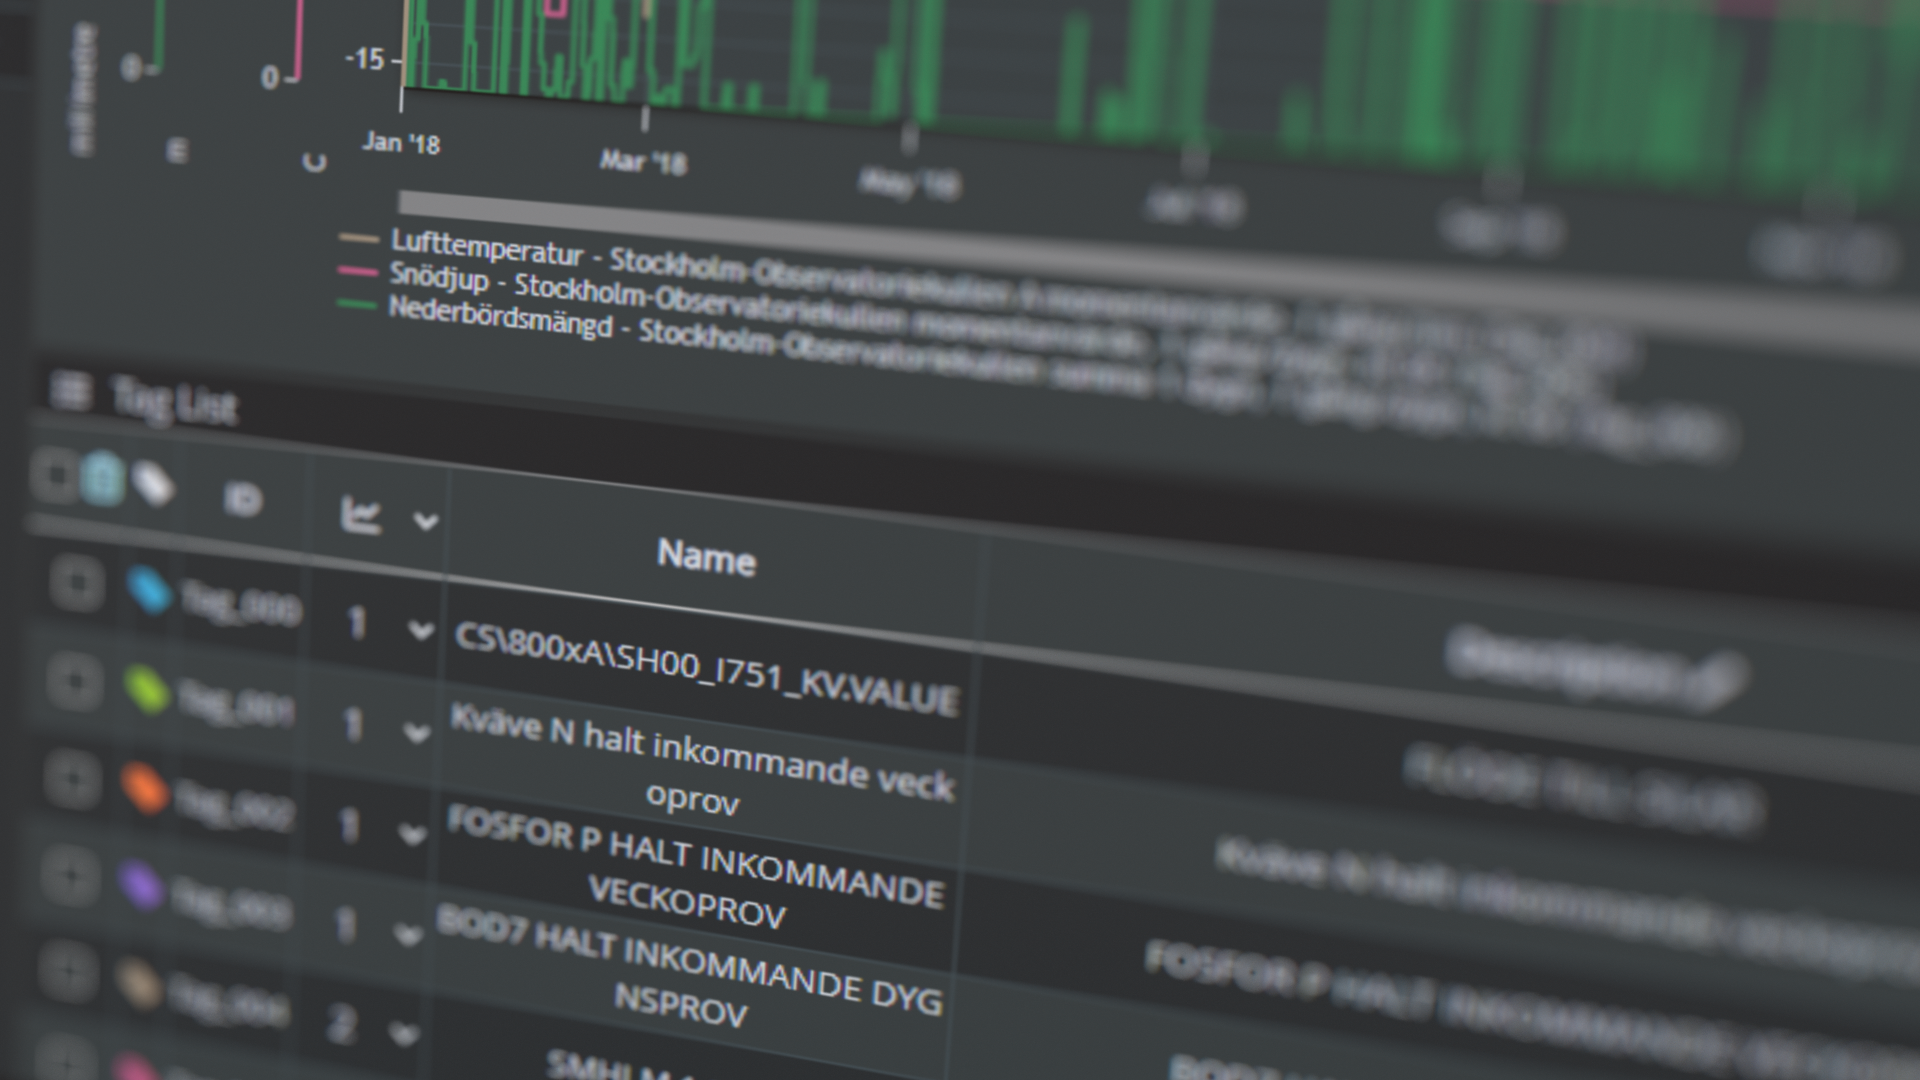
In many operations, sensor data is already there, but spread across different systems, formats and contexts. Without a consistent way to connect, structure and share it, the result is often manual work, uncertain reporting and limited operational overview. aCurve closes that gap by bringing a wide range of systems and sources into one structured environment for overview, analysis and reporting.

For control and trust in operational environments
Built for environments with rising security demands
Start focused and expand over time

Reduce manual work and improve consistency
Connect to systems already in use


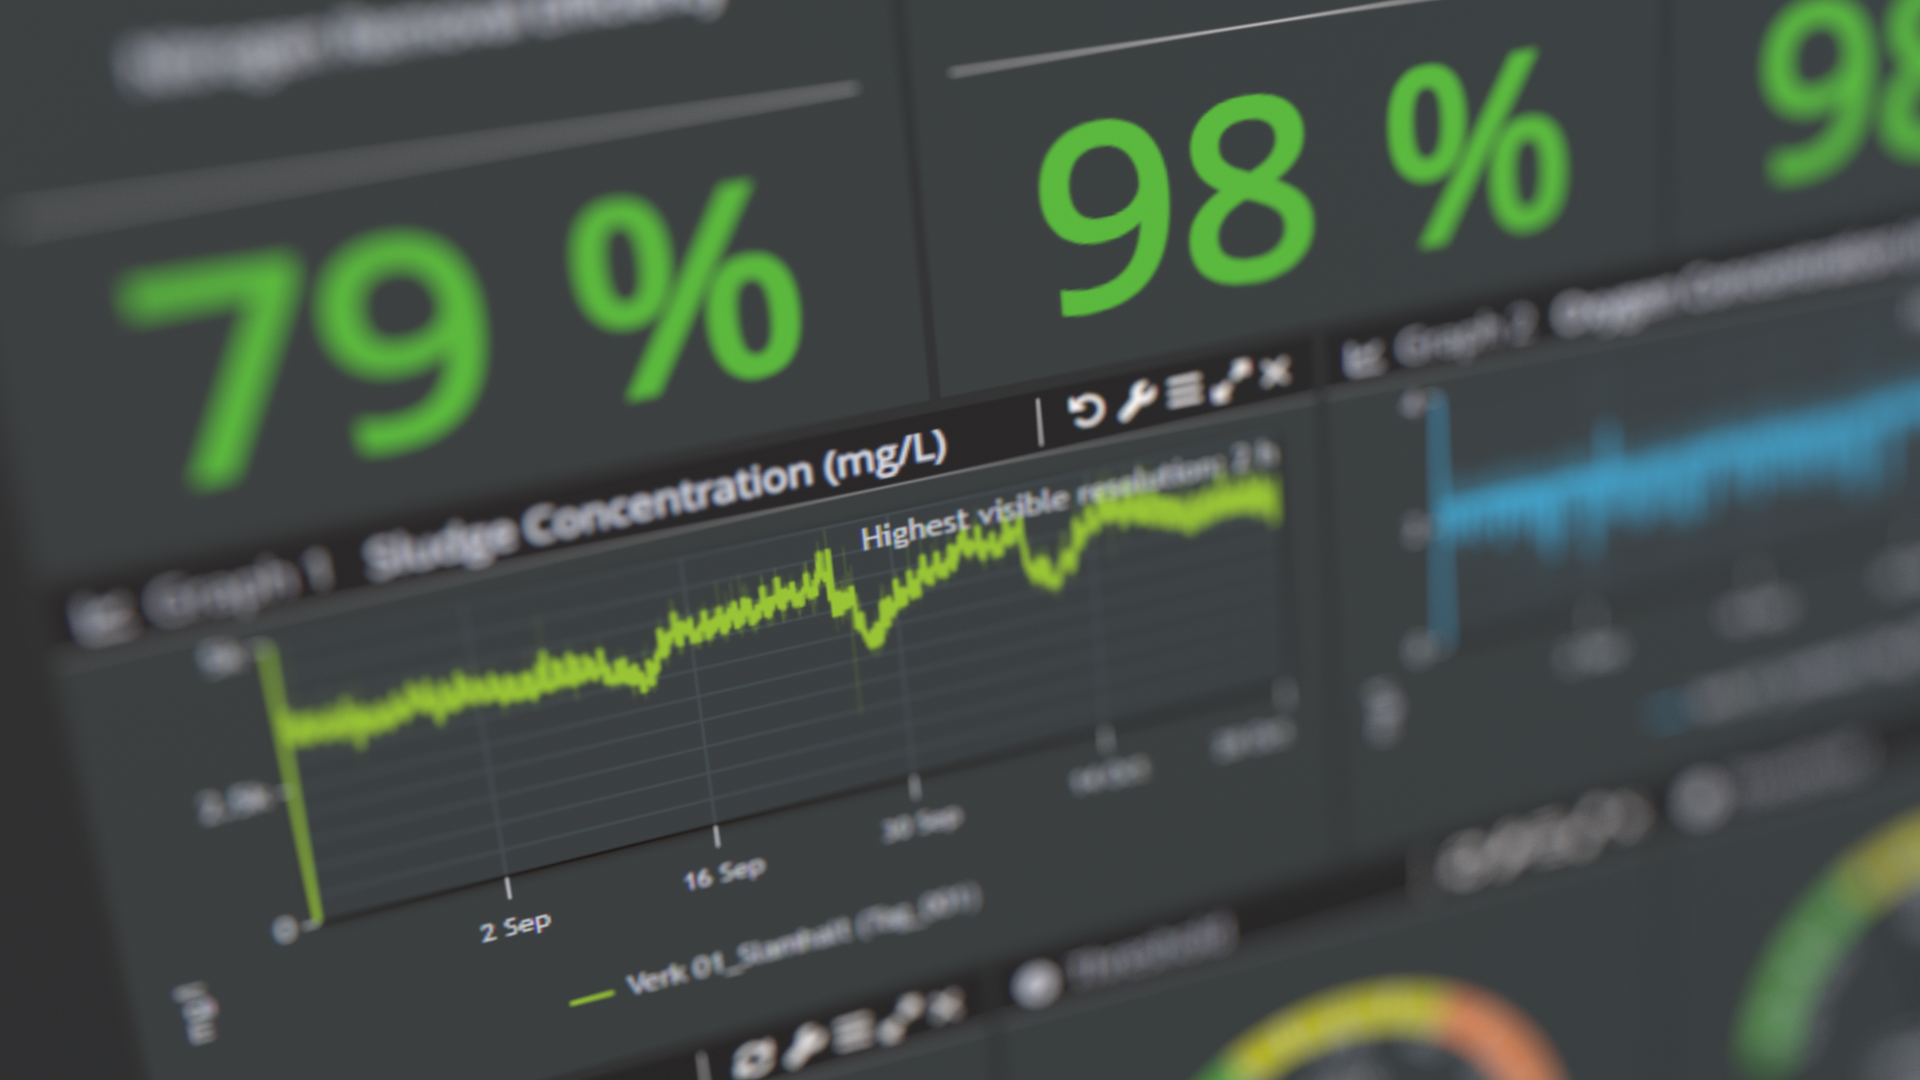
See what's happening. Understand why. Improve what matters.
Bring together data from SCADA, historians, lab systems and IoT sources.
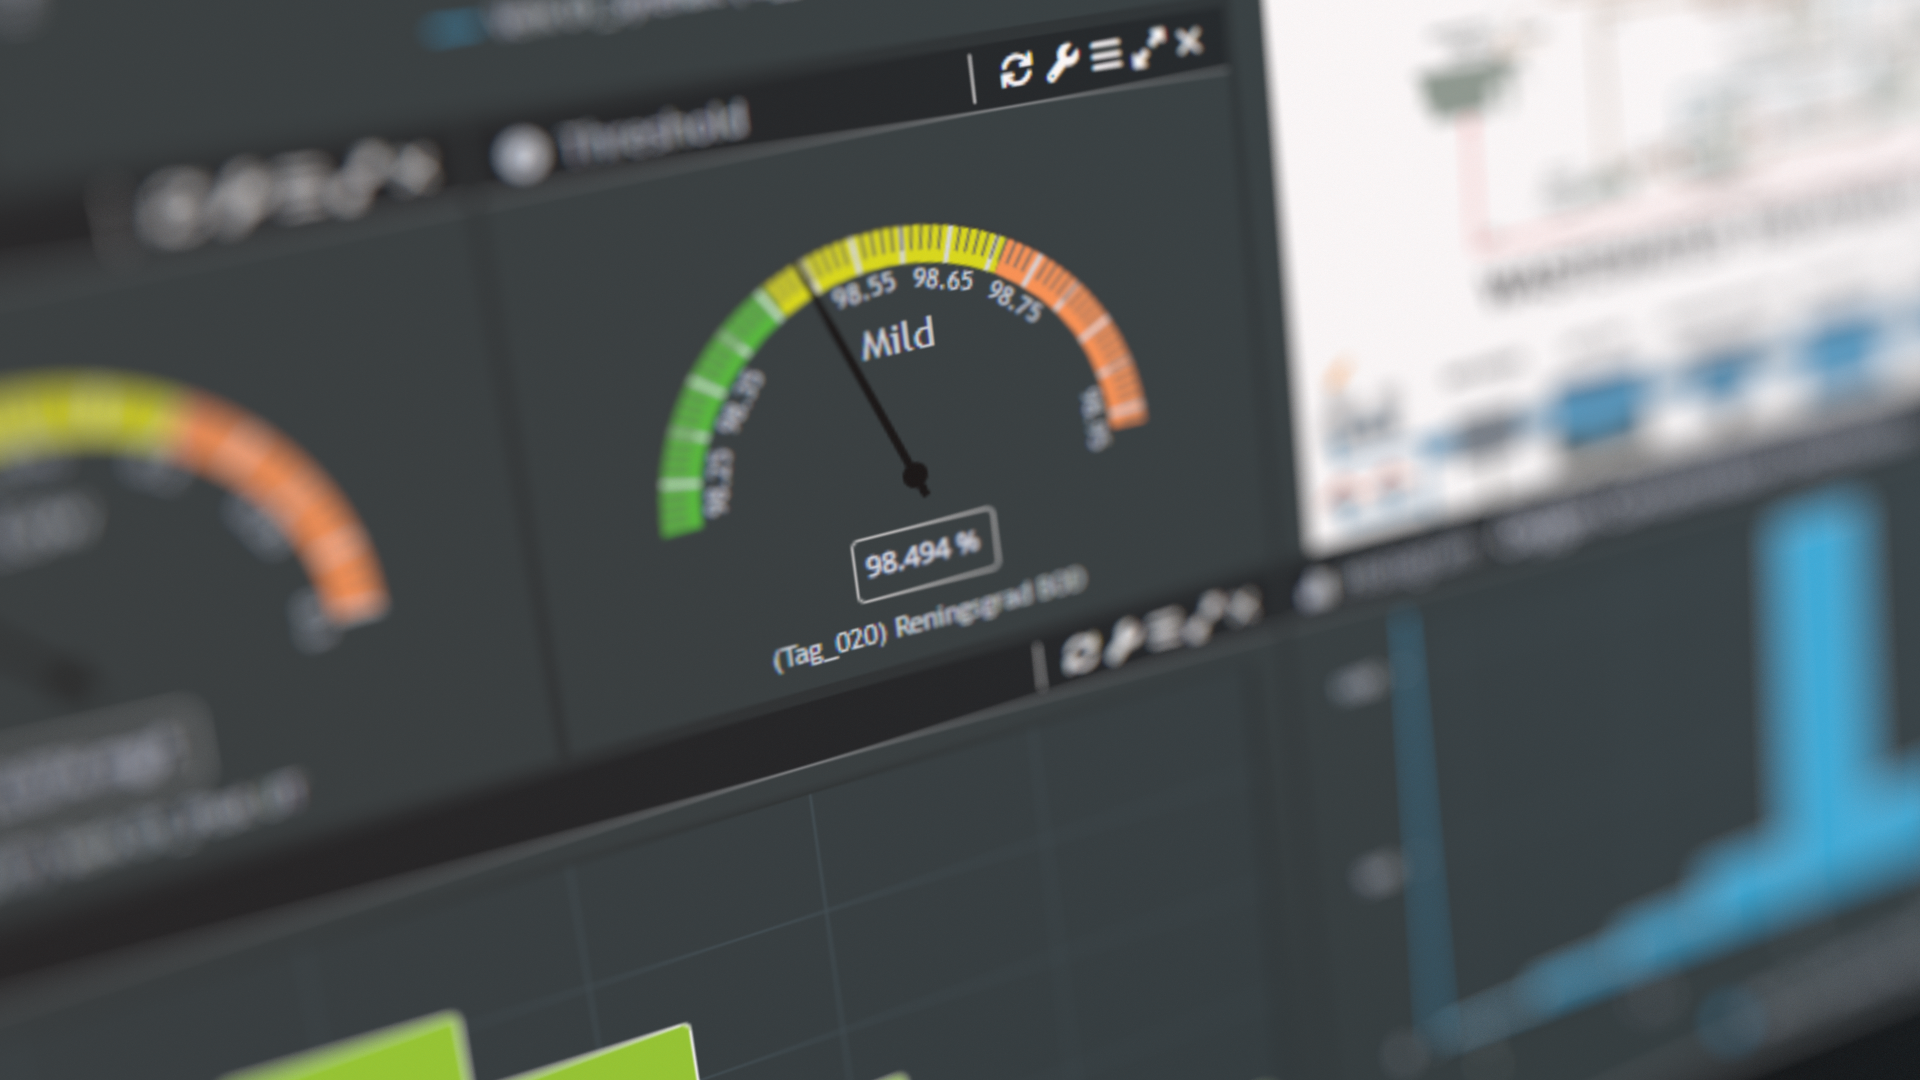
Explore trends, correlations and anomalies with powerful self-service analytics.
Turn insights into better decisions, higher efficiency and improved process performance.
What it includes
aCurve combines the core capabilities needed to turn operational data into something teams can actually use. From integration and reporting to analysis, governance and supporting data quality, the platform is built to support daily work without adding unnecessary complexity.
Store and structure operational data in a stable environment built for long-term use.
Generate and publish reliable reports with less manual work and better traceability.

Store and structure operational data in a stable environment built for long-term use.
Store and structure operational data in a stable environment built for long-term use.

Store and structure operational data in a stable environment built for long-term use.
Manage structure, consistency and user access in a more controlled environment.

Outcomes teams can rely on
aCurve brings operational data into one shared view, making it easier for teams to explore trends, compare conditions and build a common understanding. Instead of chasing down spreadsheets, people can focus on decisions and improvement.

Outcomes teams can rely on
aCurve reduces the time and effort needed to collect, structure and publish operational reports. Instead of piecing together data from multiple systems, teams can work from a more reliable foundation with better traceability and fewer manual steps.

Outcomes teams can rely on
aCurve makes it easier to explore trends, compare conditions and understand what is influencing performance over time. That creates a clearer basis for analysis, improvement work and more confident operational decisions.
What teams say about aCurve
aCurve gives us a powerful tool with unlimited possibilities to both process and create reports of data.
Michael Medóc
Process Engineer
Käppala Association, Stockholm Sweden.
Implementation steps
aCurve is designed for step-by-step implementation in your existing environment. Start with a focused scope, connect the right signals, refine definitions, and deliver an operational overview your team can use from day one. Expand to more sources, analytics and routines as needs grow.
Define a focused scope by selecting the area, goals and signals that matter most.
Connect relevant systems and sources to bring data into one structured flow.
Refine signal definitions and configuration so the setup is ready to scale with confidence.
Deliver dashboards, analytics and reports your team can use in daily operations.
Trust is built over time. It comes from consistent data, clear access control, reliable processes and the support needed to make the system usable in daily operations. aCurve is designed to help teams build an overview they can rely on month after month.
Clear access control and controlled visibility.
Reliable definitions, traceability and consistency over time.
Onboarding, guidance and ongoing support to build lasting routines.
Explore more industries
Explore how aCurve helps teams connect, structure and act on operational data across different environments.